 Honeycluster Team-
Honeycluster launched publicly on March 3rd, 2026. Within the first week, real traffic validated what months of load testing and operational hardening had prepared the platform for. Here is a breakdown of the numbers.
In the first seven days, Honeycluster served 3,100 unique users across the platform's public endpoints. The infrastructure handled sustained load without incident.
- •
1M requests sent to the platform
- •
14.8M responses delivered, including streamed WebSocket messages
- •
142.43 MB bandwidth in, 107.64 GB bandwidth out
Why responses outnumber requests
A single WebSocket subscription can generate thousands of response frames as the ledger progresses. This is expected behavior — each ledger close, transaction event, and account update produces a streamed message back to the subscriber.
WebSocket connections are the backbone of real-time XRPL applications. During launch week, the platform handled over 1,000 WebSocket sessions with strong performance characteristics:
- •
Average session duration — 216 seconds
- •
Average latency — 53 ms
Latency was tracked across both HTTP and WebSocket endpoints. WebSocket connections consistently outperform HTTP due to persistent connections and reduced overhead.
| Protocol | Avg | p95 | p99 |
|---|---|---|---|
HTTP | 322 ms | 443 ms | 812 ms |
WebSocket | 53 ms | 65 ms | 226 ms |
WebSocket is the recommended path
For applications that require real-time data — trading interfaces, payment notifications, live dashboards — WebSocket connections deliver significantly lower and more consistent latency compared to polling HTTP endpoints.
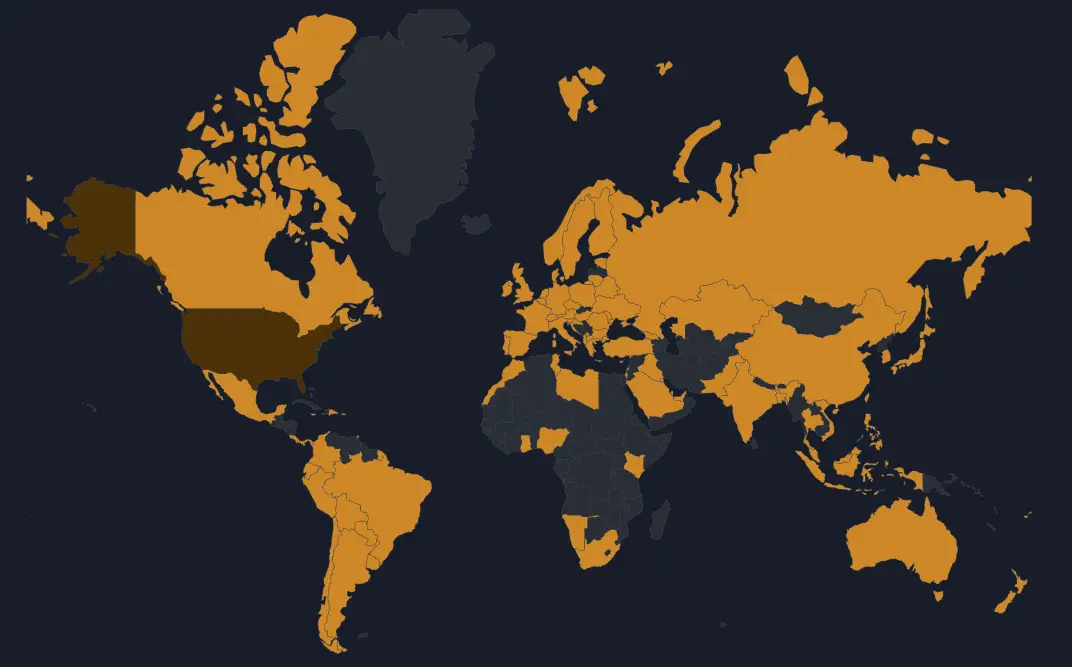
Honeycluster's infrastructure served users from 97 countries across 6 continents during the first week. The average distance from a user to the nearest Honeycluster hub was 8,023 km, demonstrating the global demand for reliable XRPL infrastructure.
Every metric in this post was pulled directly from stats.honeycluster.io — the same public dashboard that anyone can access at any time. Honeycluster's infrastructure metrics are not gated behind internal tooling or private reports. Request counts, latency percentiles, bandwidth usage, geographic distribution, and WebSocket session data are all available in real time.
This is a deliberate choice. Public infrastructure should have public accountability. If the platform is slow, overloaded, or experiencing issues, the data is there for anyone to see — not just the team running it.
Verify the numbers yourself
All metrics referenced in this post are available at stats.honeycluster.io. The dashboard is updated in real time and requires no authentication to access.
Launch week confirmed that the infrastructure performs under real-world conditions. The focus now shifts to expanding capacity, onboarding new integrations, and continuing to improve latency and availability as traffic grows.
Build on infrastructure you can trust
Managed nodes, real-time indexing, and production-grade APIs for the XRP Ledger.
 Honeycluster Team-Mar 15, 2026
Components of the Hive
A detailed look at the physical and cloud infrastructure that powers Honeycluster — from rack-mounted on-prem servers to cloud services.
 Honeycluster Team-Mar 13, 2026
Choosing a Colocation Home
Colocation, power, bandwidth, and the questions you should be asking before you sign a contract. Lessons from building Honeycluster's physical infrastructure.
 Honeycluster Team-Mar 9, 2026
The invisible layer
Most users never think about what's running beneath their favorite XRP Ledger app. Reliable data feeds. Real-time indexing. Historical analytics. That's infrastructure — and it's the reason everything just works.